Turn every conversion into performance growth
The central snapshot of platform health.
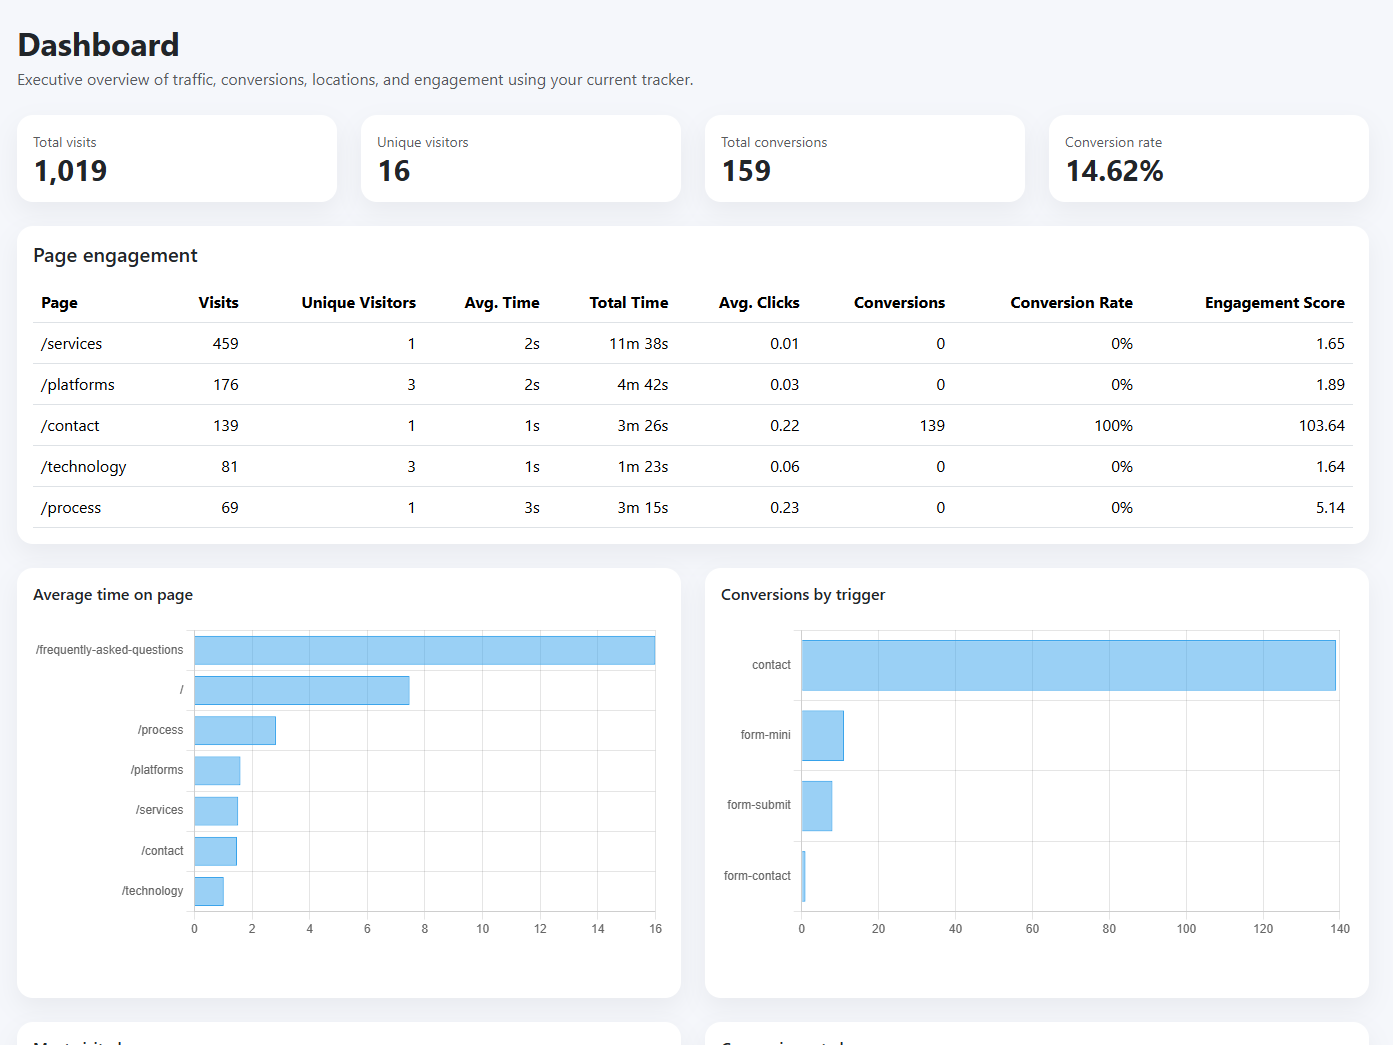
The Dashboard matters because it gives teams an immediate overview of traffic, activity, session quality, and conversion movement in one place. It reduces the time needed to understand current performance, highlights shifts early, and creates a fast starting point for deeper investigation when something important changes.
- Charts: daily visits trend, visitors by day, top pages, bounce rate by page, average time by page, conversion trend, and campaign overview summaries.
- Tables: top pages, recent traffic summaries, and high-level conversion or referral breakdowns.

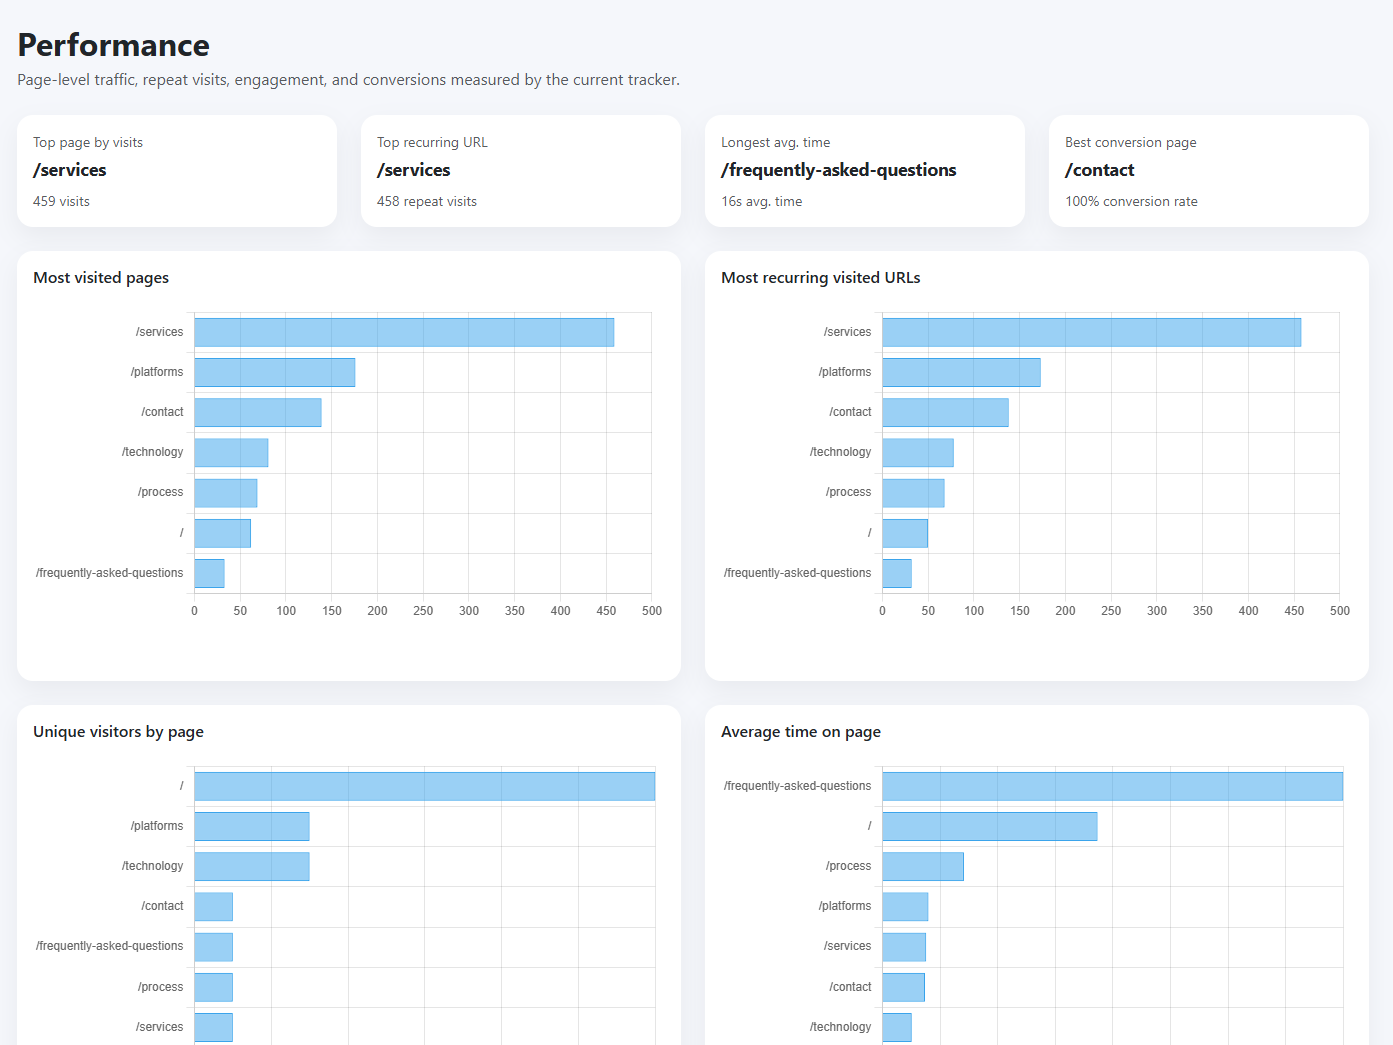
Shows what content and pages perform best.
This page improves analysis by shifting the focus from general traffic to page-level behavior. It helps teams compare pages, identify stronger content, and understand where visits are turning into deeper engagement or conversion activity, making content decisions more informed and easier to prioritize.
- Charts: pageviews by page, average time on page, bounce rate comparison, entry page distribution, and engagement by page.
- Tables: page rankings with visits, exits, time, bounce rate, and conversion contribution.

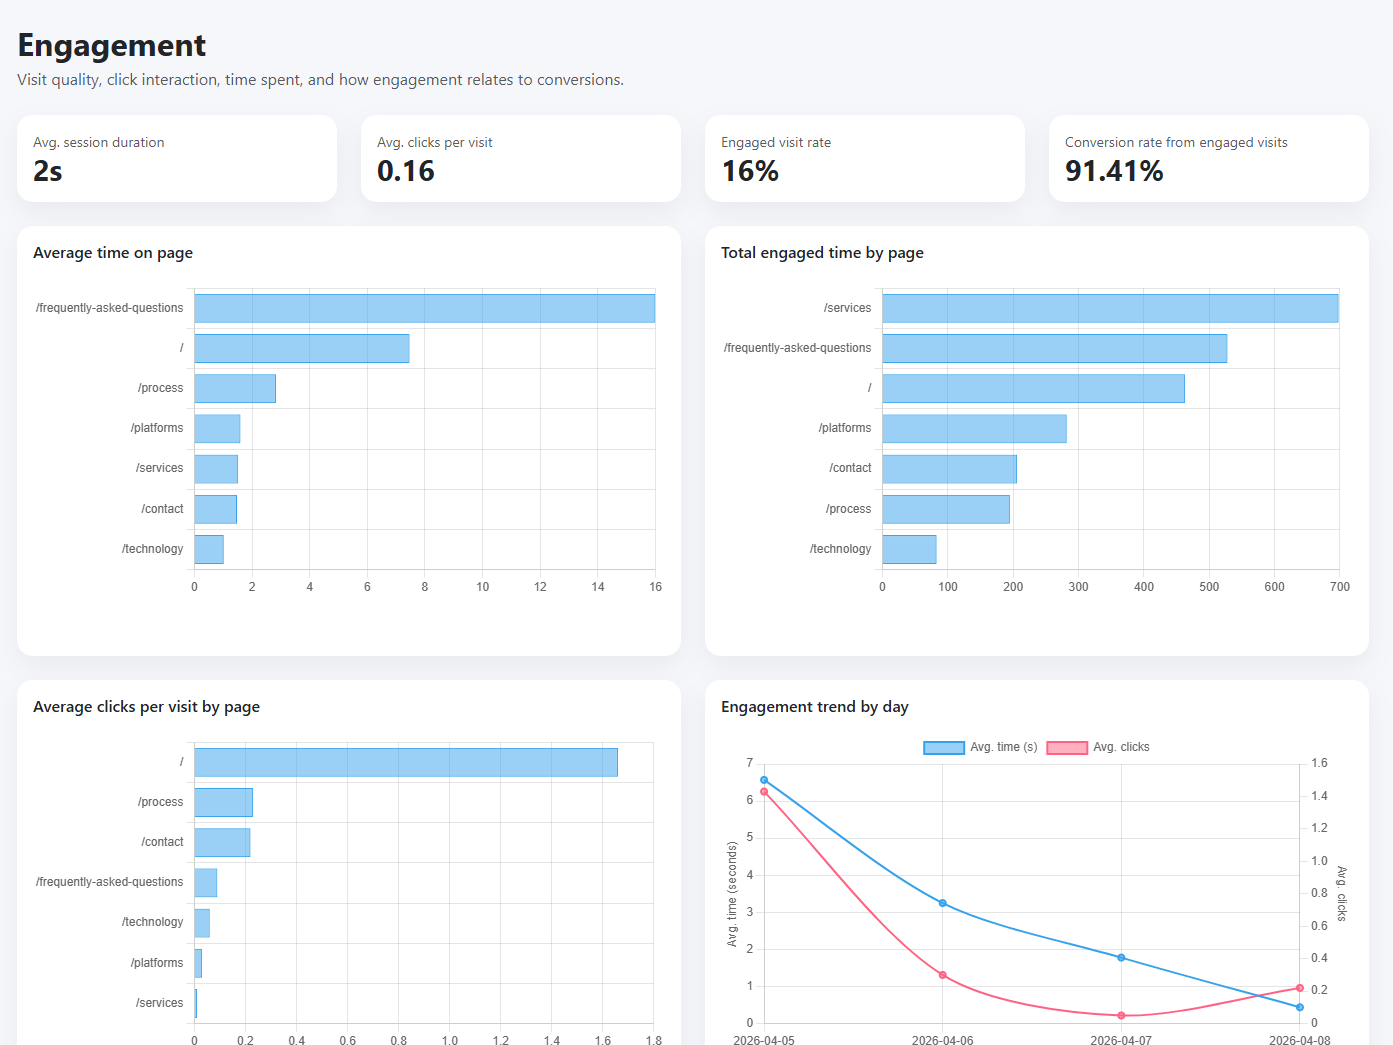
Explains session quality, not just quantity.
The Engagement page matters because volume alone does not show whether visitors actually interact with the product or content. This view helps teams understand attention, depth, and meaningful activity, making the overall analytics picture more complete and much more useful for evaluating real user interest.
- Charts: engaged vs non-engaged sessions, time on page, clicks per visit, engagement trend by day, and conversion rate by engagement segment.
- Tables: page engagement and trigger engagement breakdowns for detailed comparison.

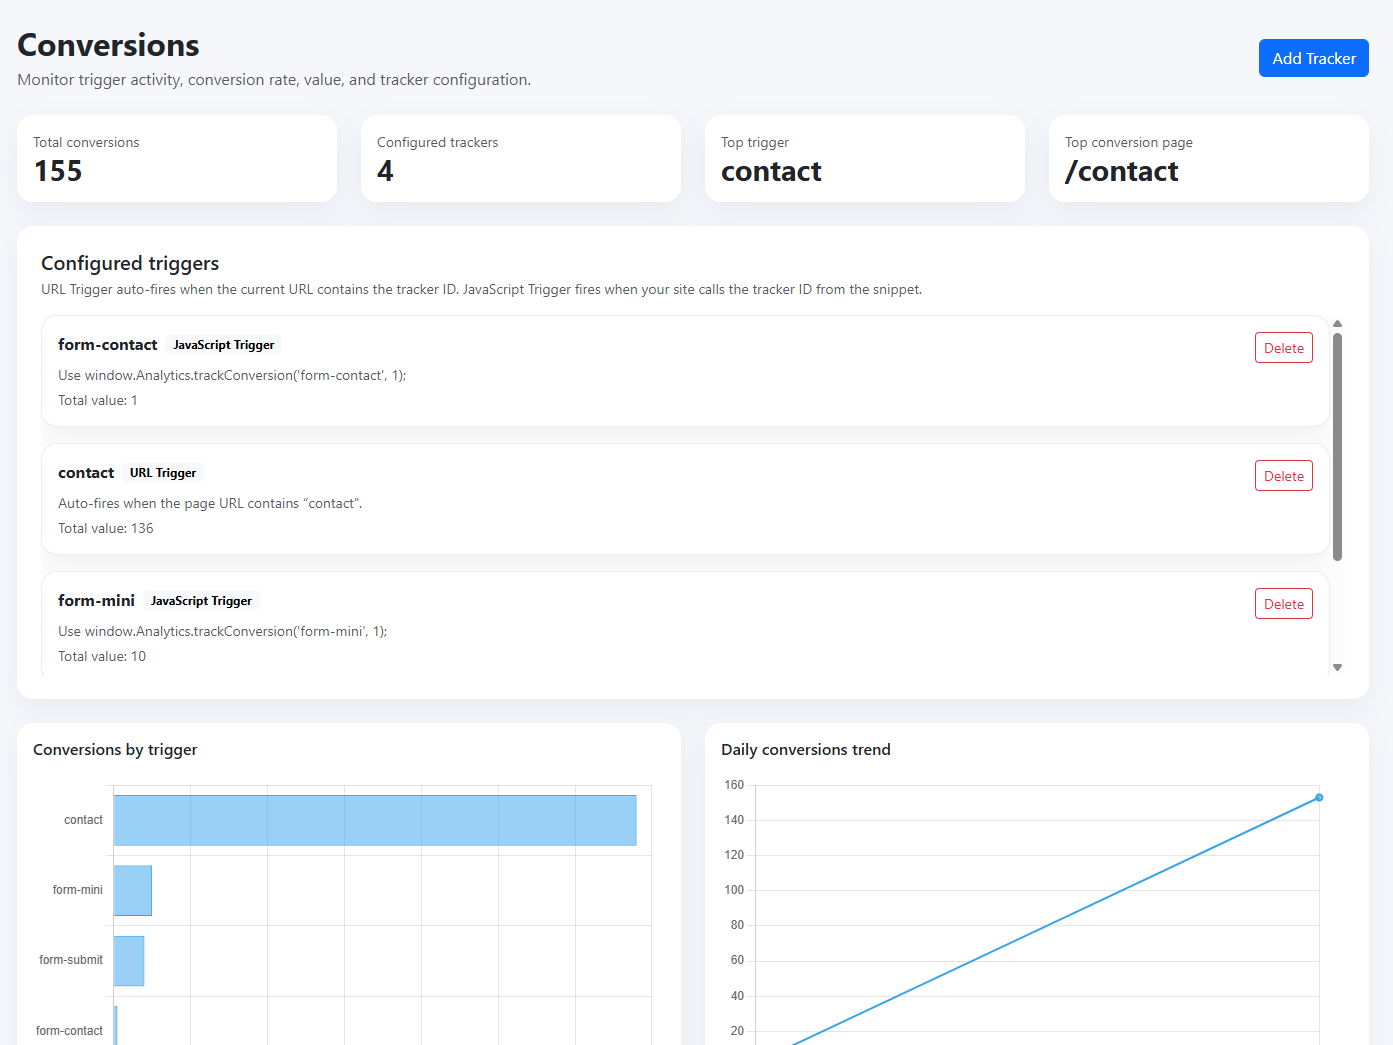
Connects configuration with measurable value.
The Conversions page matters because it links the setup of conversion trackers with the results they generate. Teams can see which triggers are active, which ones create outcomes, and how conversion value changes over time, giving them a clearer connection between configuration and measurable business impact.
- Configuration: tracker cards display trigger type, id, count, and value.
- Charts: conversions by trigger, daily conversion trend, conversion rate by page, and value by trigger.
See your analytics in one sharper, faster, more useful view.
Bring page performance, engagement signals, conversions, locations, and campaign results into a single streamlined workspace designed to help teams spot changes sooner, explain outcomes more clearly, and act with more confidence.

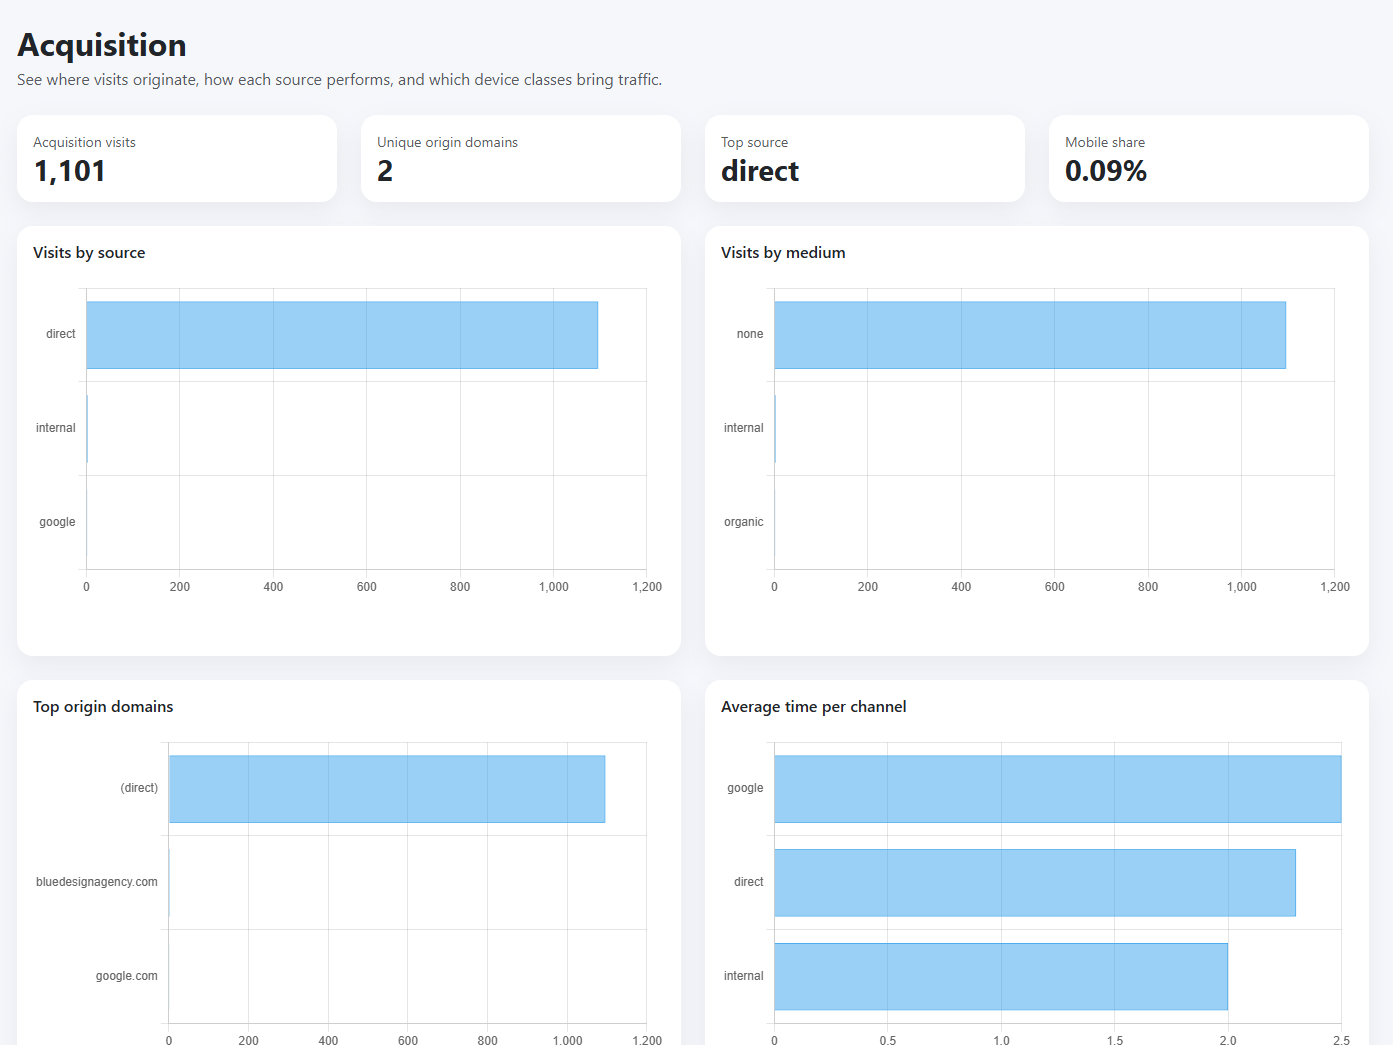
Shows where visits begin and which channels bring quality traffic.
The Acquisition page matters because it turns incoming traffic into something teams can actually compare. By combining source, medium, origin domain, engagement, conversion rate, and device mix in one view, it becomes much easier to see which channels bring stronger visits, where quality drops, and how acquisition performance differs across traffic sources.
- Charts: visits by source, visits by medium, top origin domains, average time per channel, conversion rate by source, and device breakdown.
- Tables: origin acquisition table with source, medium, origin domain, visits, unique visitors, average time, conversions, conversion rate, and device share by class.
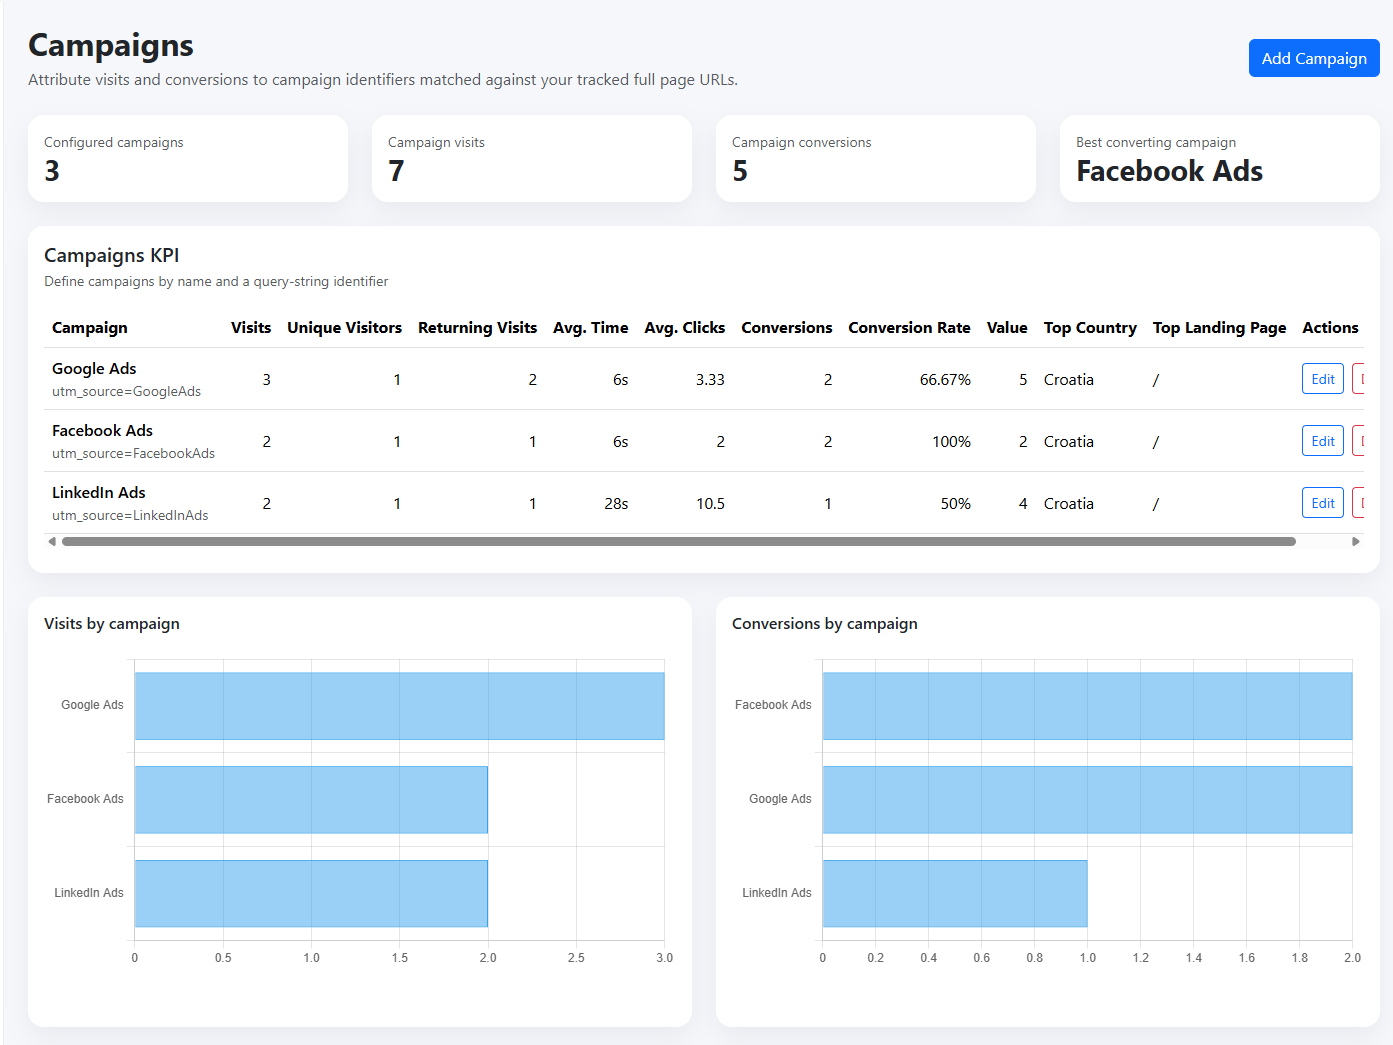

Makes attribution easier to compare.
The Campaigns view helps users move from raw traffic numbers to marketing understanding. By isolating campaign-linked visits and outcomes, it improves the overview of acquisition quality and shows which campaigns are producing stronger traffic, conversions, and value across channels, messages, and campaign periods.
- Charts: visits, conversions, conversion rate, value, and daily campaign trends.
- Tables: campaign KPI summaries, landing pages, and location breakdowns per campaign.

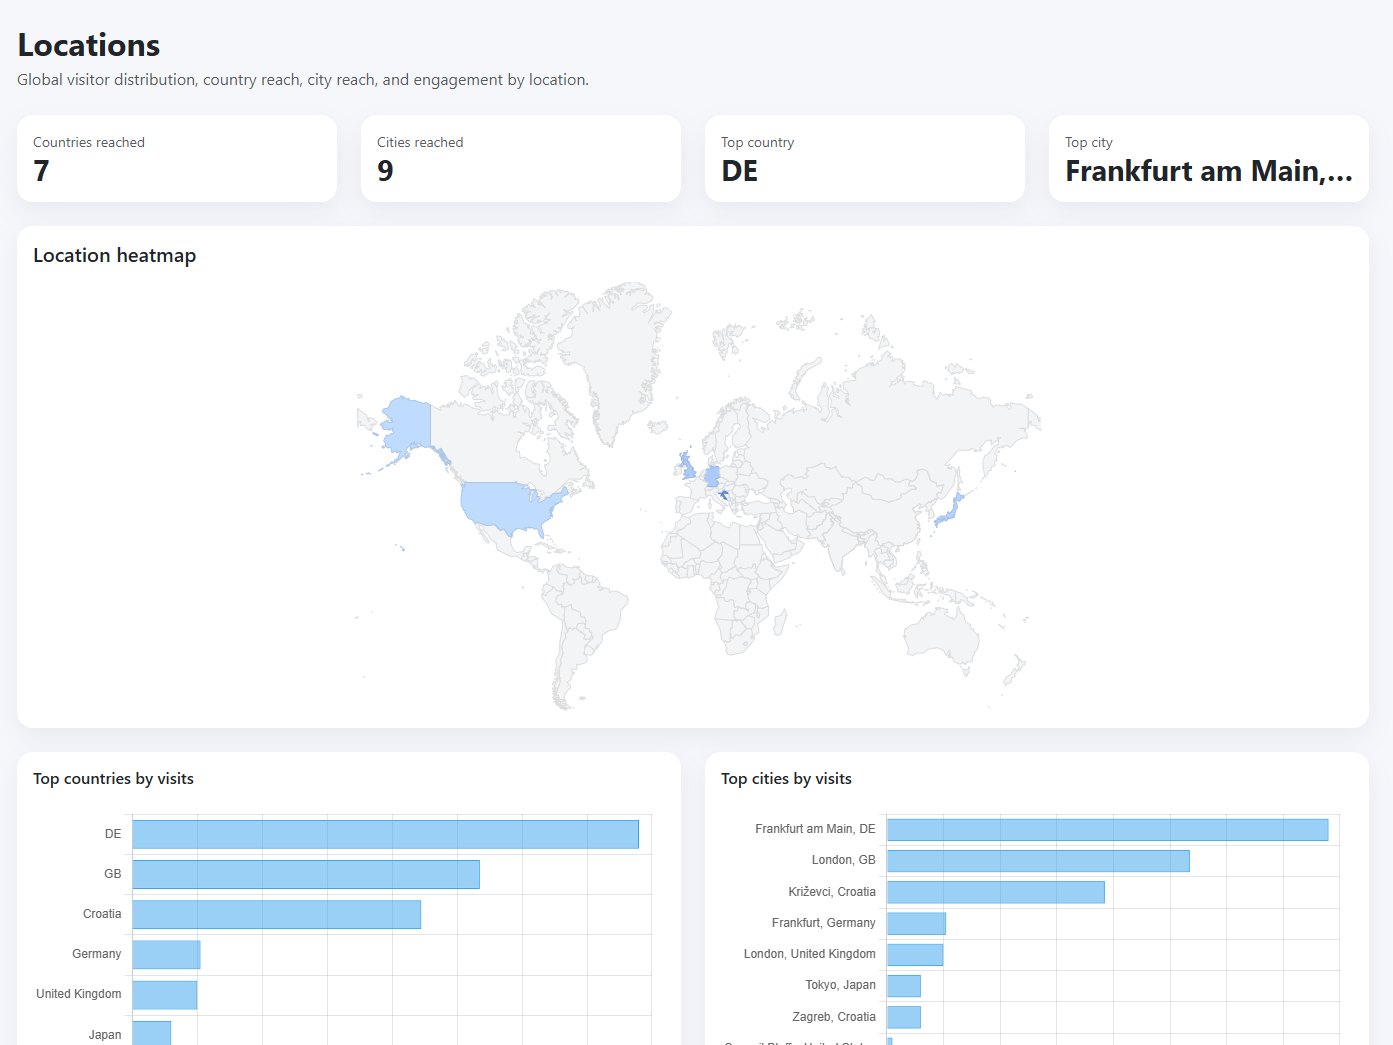
Turns audience geography into clear insight.
Locations improve overview by showing where visitors and conversions originate. This helps teams understand market reach, detect stronger regions, and compare geography against performance or campaign activity, which supports sharper decisions around regional growth and targeting.
- Charts: geographic map, top countries, top cities, unique visitors by country, and average time on site by region.
- Tables: ranked country and city views for detailed inspection.